TensorBoard概念
它是TensorFlow提供的一个可视化工具,它可以有效地展示TensorFlow在运算过程中的计算图,各种指标随着时间的变化趋势以及训练中使用到的图像等信息。
TensorBoard原理
通过读取相应的日志数据,对齐进行可视化展示。
运行TensorBoard
1.打开电脑的命令窗口,进入到项目所在目录;
2.输入命令”tensorboard –logdir=/path/to/log”并运行
3.通过浏览器打开localhost:6006
TensorBoard监控范围
1.计算图结构
2.计算节点状态
3.变量(标量、张量、输入)
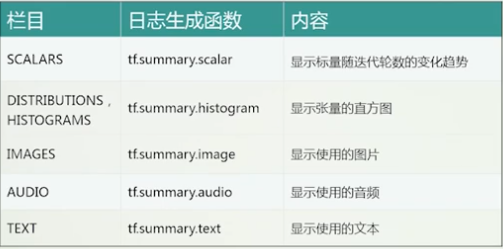
功能:主要通过调用tf.summary()类下各方法
计算图可视化
1
2
3
4
5
6
7
8
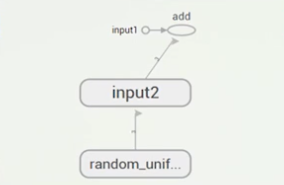
| import tensorflow as tf
input1 = tf.constant([1.0,2.0,3.0],name = 'input1')
input2 = tf.Variable(tf.random_uniform([3]),name = 'input2')
output = tf.add_n([input1,input2],name = 'add')
writer = tf.summary.FileWriter("/path/to/log", tf.get_default_graph())
writet.close()
|
以上代码输出的结构图在Tensorboard中显示如下:
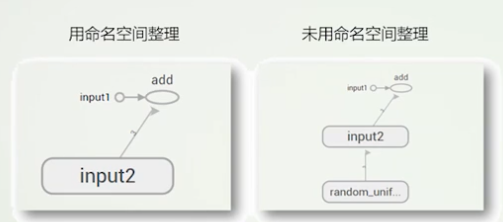
命名空间简化计算图
TensorBoard支持通过TensorFlow命名空间来整理可视化效果图上的节点。将同一个命名空间下的所有节点会被缩略成一个节点,只有顶层命名空间中的节点才会被显示。
1
2
3
4
5
6
7
8
9
10
11
| import tensorflow as tf
with tf.name_scope("input1")
input1 = tf.constant([1.0,2.0,3.0],name = 'input1')
with tf.name_scope("input2")
input2 = tf.Variable(tf.random_uniform([3]),name = 'input2')
output = tf.add_n([input1,input2],name = 'add')
writer = tf.summary.FileWriter("/path/to/log", tf.get_default_graph())
writet.close()
|
我们来看一下区别:(总的节点可以点开查看具体变量)
变量监控
图像监控
将输入向量还原成图片的像素矩阵,并通过tf.summary.image将当前图片信息写入日志。
1
2
3
| with tf.name_scope(' input_ reshape' ):
image_shaped_input = tf.reshape(x,[-1,28,28,1] )
tf.summary.image('input',image_shaped_input, 10)
|
标量监控
1
2
3
4
5
6
7
8
9
10
11
12
13
14
|
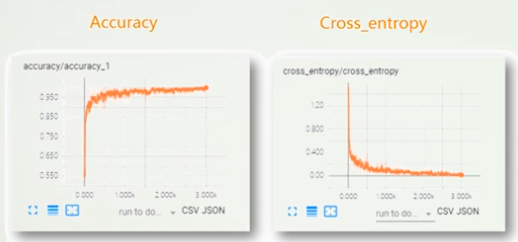
with tf.name_scope(cross_ entropy):
cross_entropy = tf . reduce mean(\
tf.nn.softmax_cross_entropy_with_logits(labels=y_,logits=y))
tf.summary.scalar('cross entropy' ,cross_entropy)
with tf.name_scope('accuracy'):
with tf.name_scope('correct_prediction'):
correct_prediction = tf.equal(tf.arg_max(y,1),tf.argmax(y_,1))
with tf.name scope('accuracy'):
accuracy = tf.reduce_mean(
tf.cast(correct_prediction,tf.float32))
tf.summary.scalar('accuracy',accuracy)
|
监控情况如下所示:
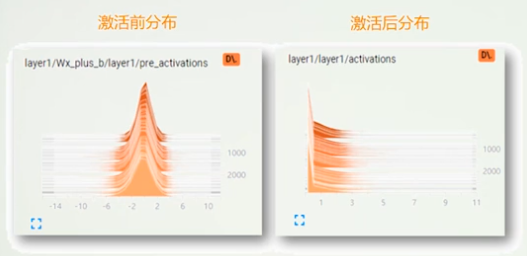
张量监控
1
2
3
4
5
6
7
8
9
| with tf.name_scope('Wx_plus_b'):
preactivate = tf.matmul(input_tensor,weights)+biases
tf.summary.histogram(layer_name+'/pre_activations',preactivate)
activations = act(preactivate,name='activation')
tf.summary.histogram(layer_name+'/activations',activations)
return activations
|
监控情况如下所示:
小结
TensorBoard可视化分析工具
分析内容
计算图状态
标量趋势
张量统计信息
输入文件(图像、文本、音频)